
How to read the numbers
HF signals travel long distances by bouncing off the ionosphere, a layer of charged gas 100 to 400 km up. The sun charges it up, so the sun's activity decides which bands are open. Three numbers tell you most of what you need to know.
| Number | What it measures | Good for HF | Bad for HF |
|---|---|---|---|
| Solar flux (SFI) | Radio noise from the sun at 10.7 cm. It tracks how strongly the ionosphere is being charged. | Above 120, and 10m opens | Below 80, and the high bands stay shut |
| K-index | How disturbed Earth's magnetic field is over the last 3 hours, from 0 to 9. | 0 to 2 | 5 and above is a storm |
| A-index | The same disturbance averaged over a day, from 0 to 400. | Below 10 | Above 30 |
You want high solar flux and a low K-index together. A high flux with a geomagnetic storm still gives poor conditions, especially on paths over the poles, such as UK to the US west coast or Japan.
Flares, blackouts and storms
A solar flare sends a burst of X-rays that reaches Earth in about 8 minutes. On the daylit side it thickens the lowest layer of the ionosphere, which absorbs HF signals, so the low bands go quiet first and everything can fade out for minutes to hours. NOAA rates these as radio blackouts, R1 to R5, and an M-class flare is usually enough for R1.
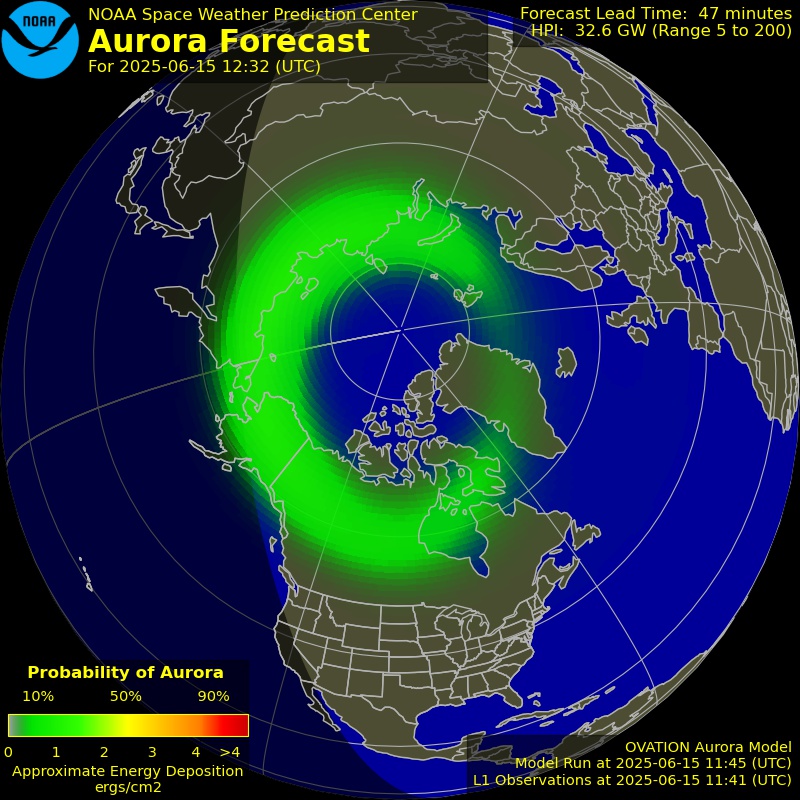
Geomagnetic storms are slower. A cloud of solar material or a fast stream of solar wind from a coronal hole takes one to four days to arrive. When the solar wind is fast and its magnetic field (Bz) points south for hours, energy pours into Earth's field and the K-index climbs. HF gets noisy and unreliable, but VHF operators watch for aurora, which can carry 6m and 2m signals across Europe.
How the band estimates work
The band table is a rule of thumb, not a propagation model. For each band it starts from the solar flux needed to open it by day and by night, then lowers the rating when the K-index is raised or NOAA reports a radio blackout. It tells you which bands are worth a listen. For a specific path at a specific time, a prediction tool such as VOACAP does a better job, and listening on the band is better still.
The band noise figure uses the K-index too. A disturbed field raises the background noise you hear on HF, so a K of 5 usually means an S4 to S6 noise floor even with a quiet local environment.
Where the data comes from
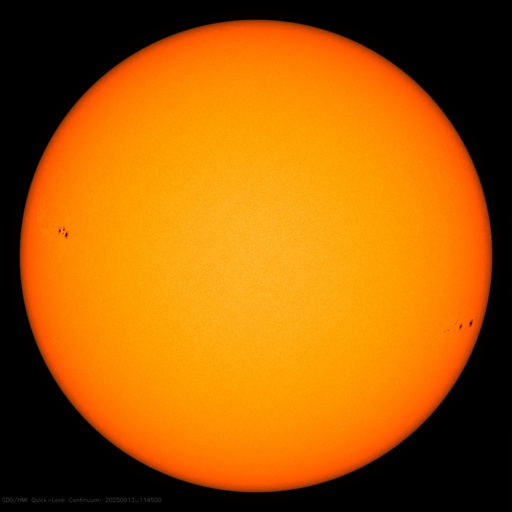
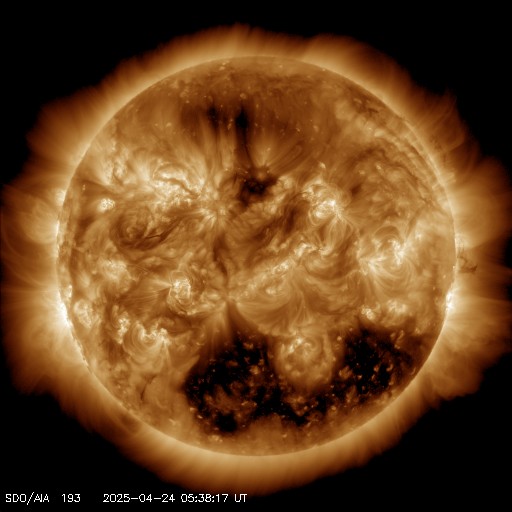
All the live figures come from NOAA's Space Weather Prediction Center, which publishes them free of charge. Solar flux is measured at the Dominion Radio Astrophysical Observatory in Penticton, Canada. K and A indices come from a network of magnetometers around the world. X-ray flux comes from NOAA's GOES satellites, and solar wind from spacecraft at the L1 point, about 1.5 million km towards the sun. The sun images are from NASA's Solar Dynamics Observatory. This page fetches everything directly from those sources each time you load it.
Questions
What is a good solar flux for HF?
Above about 120 the higher bands, 15m to 10m, open well during the day. Between 80 and 120, 20m and 17m are the reliable DX bands. Below 80, stick to 40m and 20m by day and the low bands at night.
What K-index is bad for radio?
A K-index of 4 starts to degrade HF, especially on polar paths. 5 or above is a geomagnetic storm, with high noise and fading. For VHF operators a high K-index can be good news, as it can bring aurora.
Why is 10 metres dead even though the solar flux is high?
The flux is only part of the story. 10m needs daylight along the whole path, it can close during a geomagnetic storm, and a flare can black it out. It is also seasonal: it's often better around the equinoxes in spring and autumn.
How often does this page update?
Every 10 minutes while it's open, or when you press Refresh now. NOAA updates the K-index estimate every minute, X-ray and solar wind data every minute, and the solar flux three times a day.